We are currently dedicated to addressing the backlog of issues and devising an approach to assist in prioritization. Collaboratively, @Dend and @crutkas are working together to explore the possibility of creating a unified indicator, referred to as 'centers of gravity', to gain insights into the matter.
The other day, Clint Rutkas (you know, the famous Clint Rutkas) tweeted about this cool thing that GitHub doesn't have, but could be super helpful for people who want to really dig into how well their repositories are performing - you know, finding those "center of gravity" problems. Basically, it's all about spotting the issues that are linked the most to other issues.
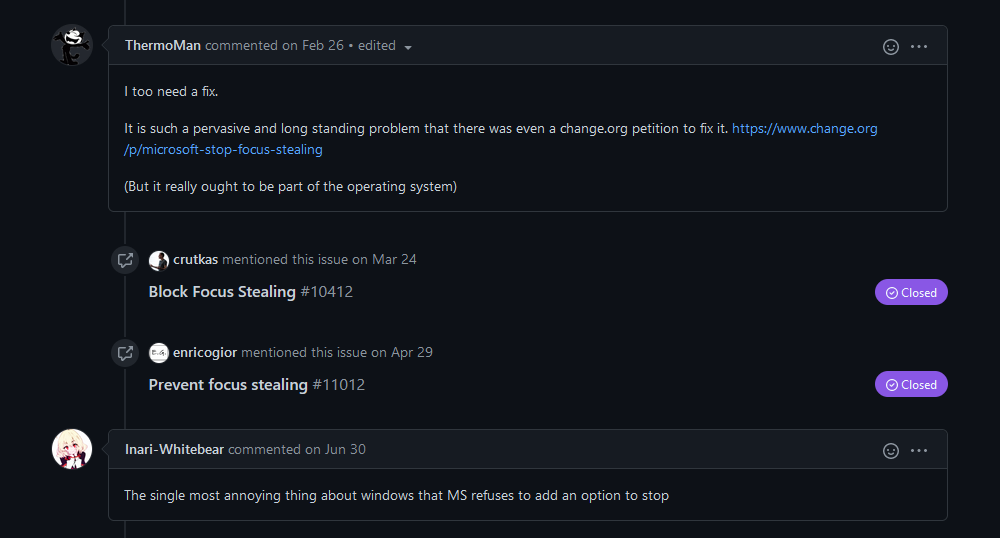
GitHub actually shows this feature with these neat, colorful references right in the issue:
When I came across that tweet, my first thought was, "This can definitely be solved with GraphQL." For those who aren't familiar, GraphQL is short for "Graph Query Language" and it allows developers to query API data as if it were coming from a database. Instead of making multiple REST API requests to different endpoints, you can simply package it all up in one request and specify the information and fields you need from other entities. It's a game-changer once you get the hang of it.
What's even more impressive is how well GitHub supports GraphQL. Their entire service is available through this API, which makes implementing the scenario above a breeze. I used the GitHub GraphQL Explorer to create a basic query (specifically for the Microsoft PowerToys repository) that should give me the data I need:
{
 repository(owner: "microsoft", name: "powertoys") {
 issues(first: 100, states: OPEN) {
 totalCount
 pageInfo {
 startCursor
 hasNextPage
 endCursor
 }
 edges {
 node {
 number
 timelineItems(first: 200, itemTypes: CROSS_REFERENCED_EVENT) {
 totalCount
 pageInfo {
 startCursor
 hasNextPage
 endCursor
 }
 nodes {
 ... on CrossReferencedEvent {
 source {
 ... on Issue {
 number
 }
 }
 }
 }
 }
 }
 }
 }
 }
}
The data was, indeed, returned:
Before we dive deeper, let's take a moment to understand what the query actually does, as it might seem unfamiliar to some.
To begin with, I request GitHub to limit the results to a single repository, specifically Microsoft/PowerToys. This is determined by the following line of code:
repository(owner: "microsoft", name: "powertoys")This query executes nested constraints within the context of a Repository object, which has its own nested entities and properties. By the way, Next, I want to get the list of open issues like this:
issues(first: 100, states: OPEN)I bind my query to an IssueConnection object, which gives me access to all issues in a repository. However, I only want to see the open issues, so I limit my query to the first one hundred issues. This is to avoid overwhelming the server with pagination constraints. To satisfy my curiosity, I also include the totalCount property to know how many issues I have to deal with. Since there are more than two thousand issues, I use a PageInfo structure to ensure that I don't get all the results at once. Look like this:
pageInfo {
 startCursor
 hasNextPage
 endCursor
}
Now that I have the basic information, I can ask GitHub to provide me with all the edges (which are basically an array of records) that represent the issues in the repository that meet the given constraints. This allows me to track if there are additional pages of results that I need to retrieve, and also provides me with the necessary details on how to access them using the startCursor and endCursor:
edges {
 node {
 number
 timelineItems(first: 200, itemTypes: CROSS_REFERENCED_EVENT) {
 totalCount
 pageInfo {
 startCursor
 hasNextPage
 endCursor
 }
 nodes {
 ... on CrossReferencedEvent {
 source {
 ... on Issue {
 number
 }
 }
 }
 }
 }
 }
}
For each issue, I can retrieve its ID and a list of timeline items associated with it. These timeline items can represent various events, but I'm only interested in tracking the cross-reference event, where someone refers to the issue I'm monitoring from another location.
Just like before, I use PageInfo to keep track if there are more timeline items than what a single query can fetch at once.
Lastly, for all cross-reference records, I know they belong to the CrossReferencedEvent type. So, I explicitly specify this assumption and request GitHub to include the source of the cross-reference. In cases where the source is an issue, I also want to know its issue number.
nodes {
 ... on CrossReferencedEvent {
 source {
 ... on Issue {
 number
 }
 }
 }
}
The result of this query might appear like this:
{
 "data": {
 "repository": {
 "issues": {
 "totalCount": 2133,
 "pageInfo": {
 "startCursor": "Y3Vyc29yOnYyOpHOGkjSHA==",
 "hasNextPage": true,
 "endCursor": "Y3Vyc29yOnYyOpHOHZoWQw=="
 },
 "edges": [
 {
 "node": {
 "number": 4,
 "timelineItems": {
 "totalCount": 27,
 "pageInfo": {
 "startCursor": "Y3Vyc29yOnYyOpPPAAABapo_WSACqTkzMTgyNTc5MQ==",
 "hasNextPage": false,
 "endCursor": "Y3Vyc29yOnYyOpPPAAABfOagI3gCqjExNDU0NzY0NjU="
 },
 "nodes": [
 {
 "source": {
 "number": 39
 }
 },
 {
 "source": {
 "number": 5
 }
 }
 ]
 }
 }
 }
 ]
 }
 }
 }
}
Wakkwaaoo! I've got all the data I needed. Now, how can I visualize it? Maybe I can write a script to reformat the JSON content into a CSV or a cleaner JSON. I also need a component in the script to handle pagination for me and store the complete list of issues. Why not make it a web-first experience? That's exactly what I did with gravity.
Gravity is primarily a code sample - it's not meant to be high-quality production code, but it does the job for this simple demo. Instead of going through every single line of code in the project, I'll focus on the important parts and explain what happens behind the scenes.
The project is built using Nuxt.js, which is a framework based on Vue. It provides several convenient features, one of which is the ability to generate a static site from API-driven fragments within the code.
To authenticate with Netlify API, I discussed it in a previous blog post where I was able to track GitHub contributions without using any client-side code.
Underneath it all, the project utilizes the GitHub GraphQL API. The query mentioned above is the foundation for how we retrieve the data.
For visualization purposes, I used D3. This saved me from having to start from scratch when it came to graph drawing.
Rest assured, no GitHub credentials are exposed on the client-side. You don't need to dig into the Network Inspector - the GitHub token is only used during the build process and is never pushed to production.
When you open the app, it's pretty simple. There's this index.vue page that does all the work. It grabs the data and connects it to two different parts - the cool graph thing and a table of issues. Each of these parts has its own file.
As soon as the page loads (keep in mind this only happens when the app is built), it sends a request to GitHub's GraphQL endpoint. This request is all about getting the list of issues.
async function getIssues(token: string | null, after: string | null) {
 console.log("Trying to get issues...");
 const headers = {
 Authorization: `bearer ${token}`,
 };
 let body = {};
 if (after) {
 body = {
 query: `query {repository(owner:"microsoft",name:"powertoys"){issues(first:100, states:OPEN, after:"${after}"){totalCount pageInfo{startCursor hasNextPage endCursor}edges{node{number title url state timelineItems(first:200,itemTypes:CROSS_REFERENCED_EVENT){totalCount pageInfo{startCursor hasNextPage endCursor}nodes{...on CrossReferencedEvent{source{...on Issue{number state}}}}}}}}}}`,
 };
 } else {
 body = {
 query:
 'query {repository(owner:"microsoft",name:"powertoys"){issues(first:100, states:OPEN){totalCount pageInfo{startCursor hasNextPage endCursor}edges{node{number title url state timelineItems(first:200,itemTypes:CROSS_REFERENCED_EVENT){totalCount pageInfo{startCursor hasNextPage endCursor}nodes{...on CrossReferencedEvent{source{...on Issue{number state}}}}}}}}}}',
 };
 }
 const response = await fetch("https://api.github.com/graphql", {
 method: "POST",
 body: JSON.stringify(body),
 headers: headers,
 });
 const data = await response.json();
 return data;
}
The token is acquired a bit earlier by fetching the secrets from the Netlify vault, which is made possible by using the @netlify/functions package.
As I mentioned before, the data received from GraphQL is not in a suitable format for easy processing and rendering. Instead, I required a format that can be easily consumed by D3, the visualization framework. I had to convert the JSON data into something similar to the code snippet below:
{
 "nodes" : [
 { ... }
 ],
 "links": [
 { ... }
 ]
}
I created a special function to calculate the nodes, which would include a list of distinct issues and their current status (open or closed). The links, on the other hand, would hold information about the relationships between the issues (such as which issue is connected to another).
function computeNodeStates(nodeContainer: Array<Edge[]> | null) {
 let nodeStates: Array<BarebonesNode> = [];
 if (nodeContainer) {
 nodeContainer.forEach(function (nodeBlock) {
 nodeBlock.forEach(function (node) {
 let topLevelNode: BarebonesNode = {
 id: node.node.number.toString(),
 group: equalsIgnoringCase(node.node.state, "OPEN") ? 1 : 0,
 };
 nodeStates.push(topLevelNode);
 node.node.timelineItems.nodes.forEach(function (referenceNode) {
 if (referenceNode.source.number) {
 let nestedNode: BarebonesNode = {
 id: referenceNode.source.number.toString(),
 group: equalsIgnoringCase(referenceNode.source.state, "OPEN")
 ? 1
 : 0,
 };
 nodeStates.push(nestedNode);
 }
 });
 });
 });
 }
 let filteredNodeStates = nodeStates.filter(
 (value, index, array) => array.findIndex((t) => t.id === value.id) === index
 );
 return filteredNodeStates;
}
Because I'm using TypeScript, I can take advantage of object types. So, all I have to do is go through the JSON I received from GitHub and add every identified issue to an array. This includes both the top-level issue and any nested issues that reference the top-level one. After that, I make sure to remove any duplicates from the array before returning it.
Now, let's talk about the group property. What exactly is it? Earlier, I mentioned that I only wanted to query open issues in the repository. However, I didn't mention that cross-referenced issues can also be closed. Imagine a situation where an issue is closed because it's a duplicate of another issue. In this case, depending on the state of the issue, I assign it to either group 1 (if it's open) or group 0 (if it's closed). This will come in handy later when we display the graph.
As for the links, the process is quite similar when it comes to parsing the JSON returned by the GitHub GraphQL API. Luckily, I already have a function for that.
function computeLinks(nodeContainer: Array<Edge[]> | null) {
 let relationships: any = [];
 if (nodeContainer) {
 nodeContainer.forEach(function (nodeBlock) {
 nodeBlock.forEach(function (node) {
 let number = node.node.number;
 node.node.timelineItems.nodes.forEach(function (referenceNode) {
 if (referenceNode.source.number) {
 let relationship: Relationship = {
 source: number.toString(),
 target: referenceNode.source.number.toString(),
 weight: 6,
 };
 relationships.push(relationship);
 }
 });
 });
 });
 let filteredRelationships = relationships.filter(function (
 entity: Relationship
 ) {
 return entity.source != null && entity.target != null;
 });
 return filteredRelationships;
 } else {
 return { error: "Could not compute links." };
 }
}
Each relationship is formed by using the ID of the main node (the issue number) and any linked nodes (referenced issues). After that, all of this is stored in an array. We then filter out any relationships where the source or target might be null (which doesn't happen often and is checked in the function). Finally, we return the array to the function that asked for it. But which function was it?
There's a function called asyncData that gets called when the page loads. It neatly wraps the functions mentioned above like this:
let relationships = computeLinks(sanitizedIssues);
let nodeStates = computeNodeStates(sanitizedIssues);
let d3data: D3DataContainer = {
 nodes: nodeStates,
 links: relationships,
};
So, in the example given, the D3DataContainer is basically an interface that fulfills all the requirements that were mentioned earlier for the D3 data ingestion:
export interface D3DataContainer {
 nodes: Array<BarebonesNode>;
 links: Array<Relationship>;
}
The hard part is over! Now it's time to display the data. Using the JSON blob that I have, I send it to a createNetwork function that calculates the edges and nodes of the graph. Then, I pass that information to D3 to create a force layout, which uses a physics-based simulator to position the visual elements. This means that the elements can have a "charge" and can either attract or repel each other. And the best part is, we also have gravity included - what more could we ask for!
There is a little bit of setup involved to define the style and behavior of the graph, but once that's done, we get to see the complete representation of the graph in all its glory.
Did you notice how GitHub uses different colors to distinguish between closed and open issues? Closed issues are colored in purple, while open issues are green. It's a clever way to make it easy to spot the relationships between them. And that's not all! You can also zoom and pan through the graph to see the full picture. It's pretty rad!
In conclusion, this challenge was a lot of fun to explore. I still have some updates to make to the "README" with deployment and modification instructions, so stay tuned for that. Hopefully, in the future, I'll have more time to improve and productize this experience even further.